Reporting and Analytics.
Reporting and Analytics Features:
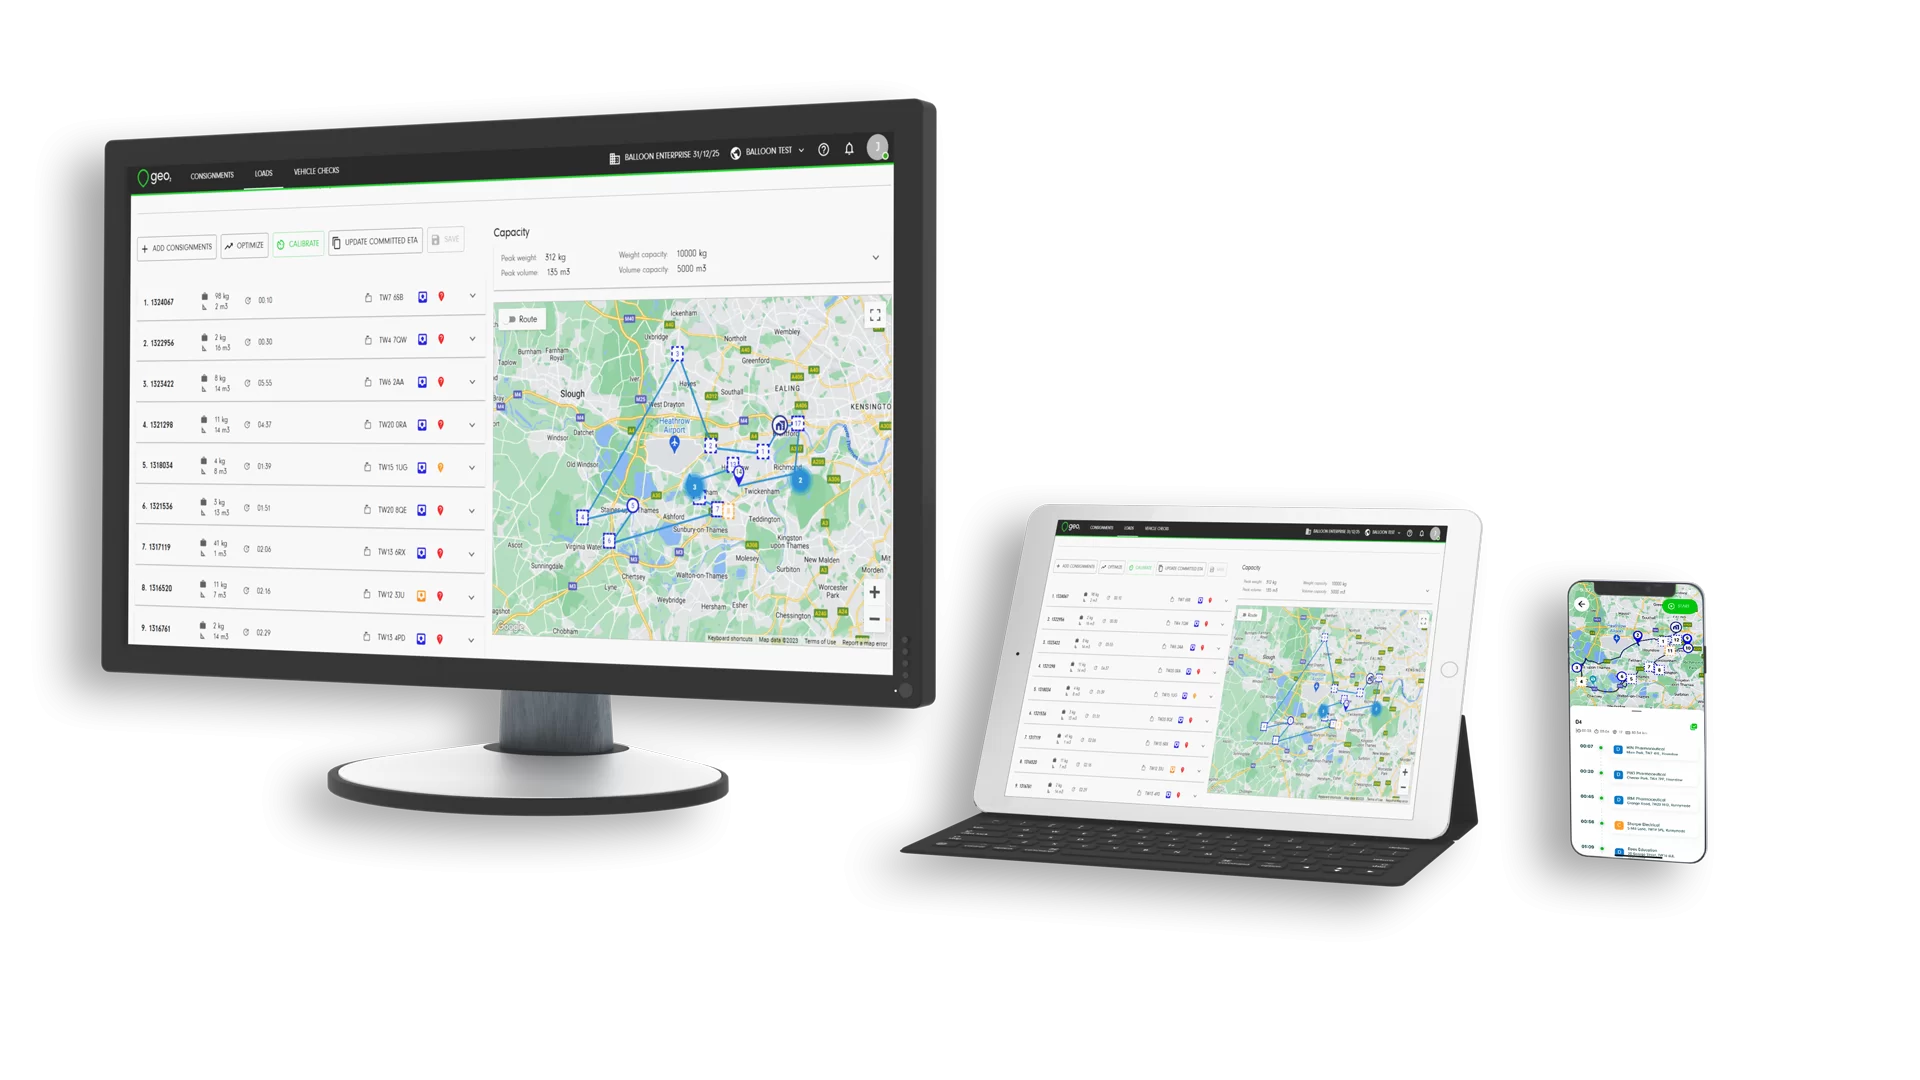
Monitor key metrics
Uses real-time data
Large selection of analytics
Drag and drop charts to personalise your dashboards
Live driver locations
CO2 emissions tracking
CO2 emissions per consignment
View analytics by date or date range
Consignments: delivered, undelivered, by load assignment, by area, on-time consignments by driver, and more
Peak vehicle measurements: weight capacity, volume capacity, weight and volume, and more
Reporting and Analytics with Geo2.
With informed decision-making, stay ahead of the competition, allocate your resources more effectively and keep your customers happy. The reporting and analytics functionality in Geo2 will help you revolutionise how you manage and optimize your logistics operation. With this powerful and intuitive tool, you will be able to harness real-time data to monitor your key metrics and gain valuable insights.
Track your loads, live driver locations, emissions data, consignment details and peak vehicle measurements and use the insights to enhance your efficiency, reduce costs and boost performance. With the ability to personalise your dashboard using drag and drop charts, Geo2 gives you the flexibility to tailor your transportation analytics and reports to your specific needs.
Load Analytics.
With a better understanding of your load dynamics, you can improve your efficiency. Using these load analytics, you can optimally allocate your resources, avoiding missed deadlines, customer dissatisfaction and increased operational costs.
‘Loads by Status’ lets you monitor the number of loads scheduled for delivery on any given day. This keeps you on top of your daily workload, helping you plan and allocate your resources effectively.
‘Loads by Vehicle’ provides a clear view of the percentage distribution of loads assigned to each vehicle in your fleet. This helps you to optimize vehicle utilisation, ensuring your resources are neither underused nor overburdened.
‘Loads by Area’ shows the percentage distribution of loads across different geographical areas. This helps you identify high-demand regions and strategically plan your transportation routes for maximum efficiency.
CO2 Emissions Tracking.
Embrace sustainability by tracking and reducing your carbon footprint. With valuable insights into your carbon emissions, you can take meaningful steps towards reducing your environmental impact.
View your total ‘CO2 Emissions’ or use the more granular view to see ‘CO2 Emissions Per Consignment’.
You can view your CO2 emission data by date to give a concrete measure of your environmental impact over time. This will help you set sustainability goals as well as to evaluate the effectiveness of your efforts and demonstrate your environmental commitment to customers and other stakeholders.
Consignment Analytics.
With comprehensive insights into your consignments, you gain a new level of precision that will help you achieve a more efficient and customer-centric delivery operation.
The ‘Consignments by Load Assignment’ report shows consignments assigned to a load versus those not assigned to a load within a specific date range. This can help you to manage your resources more effectively.
‘Consignments by Area’ shows the percentage of consignments assigned to each area, giving you a deeper understanding of the geographical distribution of your consignments.
View ‘Delivered Consignments’ to assess your drivers’ successful delivery rates. Sorted from highest to lowest – and based on the percentage of consignments with a successful Proof of Delivery (POD) – this report helps you identify your top-performing drivers.
‘Undelivered Consignments’ works in the same way, identifying the total number of undelivered consignments and the percentage for each driver. This can help you to pinpoint areas where improvements or extra training may be needed.
The final driver report for consignments displays ‘On-Time Consignments by Driver’. This lets you analyse driver performance based on their on-time, late and early deliveries. This delivery analytics metric is critical for managing both driver efficiency and customer satisfaction.

Peak Vehicle Measurements.
Optimize vehicle capacity to boost efficiency and reduce your costs. With powerful analytics that reveal vehicle weight and volume usage, you can make loading decisions that will enhance your fleet’s performance.
With a clear understanding of the weight and volume capacity of your fleet, you can be certain that you are neither overloading nor under-utilising your vehicles. With optimized vehicle loading, you decrease fuel costs and maximise vehicle lifespan.
The ‘Peak Vehicle Weight Capacity’ bar chart displays the average peak weight for all loads assigned to vehicles, providing a clear view of used and available weight capacity. It’s a key tool for informing your load optimization efforts.
Similarly, the ‘Peak Vehicle Volume Capacity’ bar chart shows the average peak volume for all loads assigned to vehicles, highlighting used and available volume capacity.
‘Peak Vehicle Weight’ and ‘Peak Vehicle Volume’ are line charts that depict the average peak weight and volume for all loads day-by-day, categorised by vehicle. This granular data allows you to spot trends and performance variations for individual vehicles.
Functionality
More info.
Route Planner & Route Optimization.
Use route optimization features that find the optimal route for multiple deliveries, minimising travel times and mileage. This translates to greater efficiency, reduced cost and improved customer satisfaction.
iOS & Android Mobile App.
Geo2 can be accessed and used on any smartphone, whether you use and Apple phone or an Android phone. The Geo2 app can be accessed from the Google Play Store or the Apple App Store.
Electronic Proof of Delivery.
Ensure that all of your deliveries arrive safely to the customer with Electronic Proof of Delivery. Image proof, a signature, and a record of the gps coordinates prevent false claims and ensure your customers receive their deliveries on-time, in-full.
Real-Time Tracking Visibility.
Track your fleet with live-visibility and share delivery tracking with customers. Geo2 responds immediately to real-time events such as traffic, bringing greater flexibility and responsiveness to improve efficiency and meet customer expectations.
Cloud-Based, Scalable Solution.
Built in the Cloud, Geo2 can be used wherever there is an internet connection. The Cloud-based product allows for a rapid setup and quick ROI. Data is highly secure with no limitations from digital infrastructure.
Order & Delivery Management Web Hub.
Use the Geo2 Hub to manage your order and delivery inforamtion. Upload data via a spreadsheet (CSV), or connect your systems via Geo2's API. Managing your orders and deliveries has never been easier.
Vehicle Walkaround Checks.
Prevent unwanted setbacks in your delivery operation with Vehicle Checks. By monitoring and tracking the condition of your vehicles, you can have peace of mind that no costly surprises will occur, ensuring your deliveries will always be made.
Data Analytics & Reporting
Track and monitor your operation with real-time analytics. Use analytical insights to determine the efficiency of your operation and identify areas for improvement. Track CO2 usage and report on costs.
And so much more…